OK, let's start graphing!
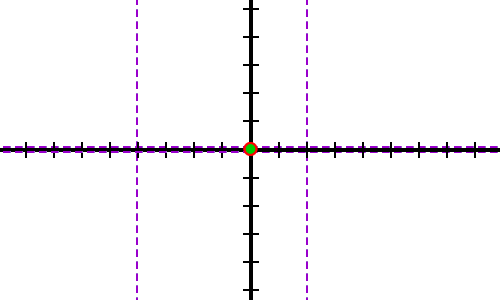
Let's get our intercepts and asymptotes down:

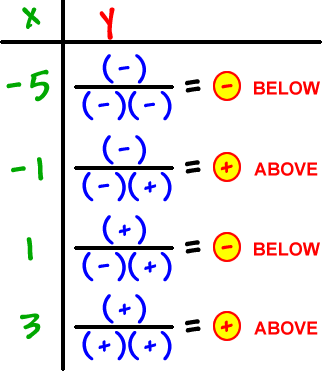
Since we've got that pesky y = 0 horizontal asymptote, we can't use our "nowhere else" info on the x-intercepts to figure out the "upstairs" or "downstairs" stuff. Until we have Calculus, we're going to have to humble ourselves and plot some points -- kind of! We're going to avoid taking that pathetic trip to Sissyville by cheating a little bit... I call it "quickie plotting."
Four strategically located points will do it and all we really need to know is if he's above or below the x-axis at each point.
We'll be plugging x's into the factored form:
 | * We only care about positives and negatives -- See if you can do it! |
 |  |
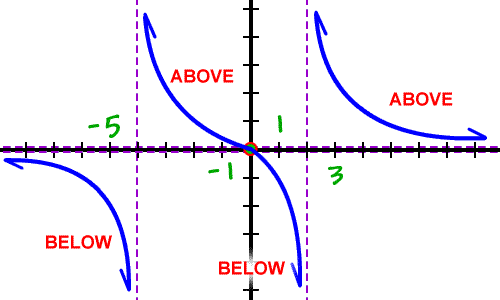
Now we've got it! Remember that he can only cross the x-axis at
x = 0... So, once he's below, he'll be stuck there... and, once he's above, he'll have to stay above:
