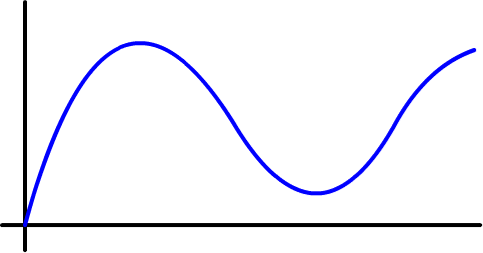
Let's say I've got a graph describing Coolmath's revenue...
(fictional!)

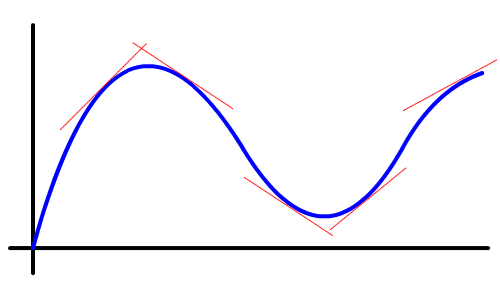
Let's plop some tangent lines in there:

It's pretty clear that the tangent lines with positive slopes are good (yea - profits are going up)... and tangent lines with negative slopes are bad (boo - profits are going down.)
So, slopes of tangent lines can tell us where a graph is increasing or decreasing.
But, we can use tangent lines to tell us even more than that.