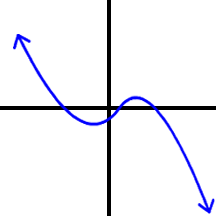
Look at this graph:

y = -x^3 + some x stuffa possible graph of y = -x^3 + some x stuff

Remember that this guy goes on forever.  That's what those arrows are for!
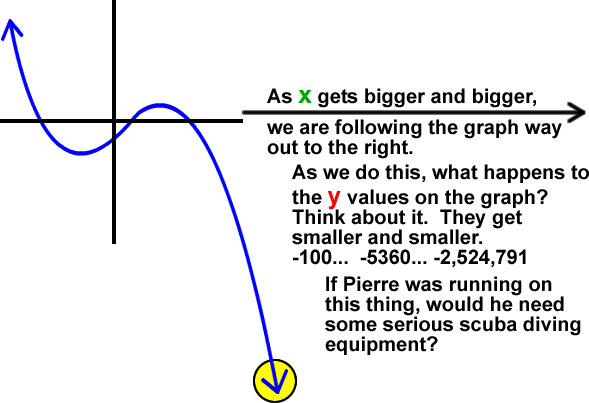
graph looking at the eventual behavior of the downward tail  ...  As x gets bigger and bigger, we are following the graph way out to the right.  As we do this, what happens to the y values on the graph?  Thiink about it.  They get smaller and smaller.  -100...  -5360...  -2,524,791  If Pierre was running on this thing, would he need some serious scuba diving equipment?

As x gets bigger and bigger, the height of the graph is going down, down, down!

To get a little math notation going...

As


This little arrow can be read as "approaches" or "goes to."

And remember that f(x) is just a fancy name for y...

As