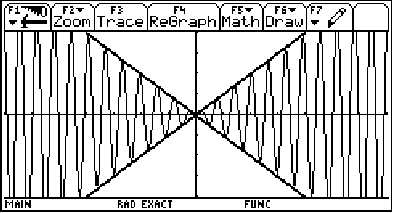
The graph of g(x) = sin(10x) is getting squished (or damped) between the graphs of y = x and y = -x !!
Don't believe me? Then check it out! Let's graph f(x) = x*sin(10x),
y = x and y = -x all on the same graph...

(y=x and y= -x are the thicker lines.)
We see that our sine graph is, indeed, bounded between them! Pretty cool, huh?
In the function
![]()
this x is called the damping factor.
Let's try something more complicated.
What would the graph of f(x) = (log x)*cos(15x) look like?
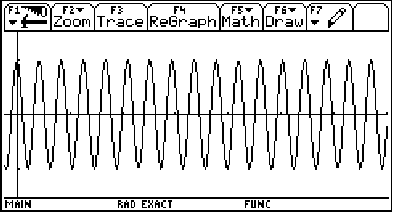
Well, g(x) = cos(15x) looks like:

(graphing window: x on [-.235, 7], y on [-1.5, 1.5])
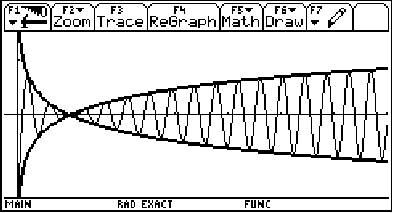
Our damping factor is log x. So, g(x) = cos(15x) is going to get bounded by
y = log x and y = -log x . (Note that g(x)=cos(15x) is also going to get restricted to the domain of y=log(x) which is x>0.)
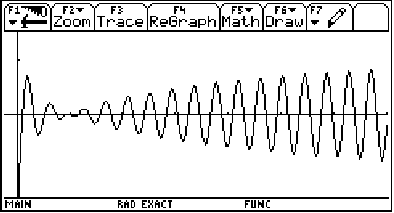
Let's see what it will look like!

(graphing window: x on [-.235, 7], y on [-1.5, 1.5])
It sure looks like it's bounded by those logs... Let's graph them to be sure!

Yep! (Looks like the messy end of a fish, doesn't it?)