TRY IT:
Graph ![]() on a number line.
on a number line.
Graph ![]() on a number line.
on a number line.
What about something like this?
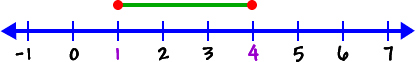
This means that x can be 1... or x can be 4 ... or x can be any number between 1 and 4 ... Like 2 or 3.01459.
One way to write this interval is
![]()
(read as "x is greater than or equal to 1 and less than or equal to 4")
So, how would we graph this on a number line?
![]()