Let's try a messier one:
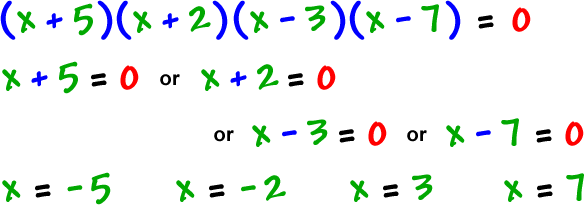
Find the real zeros of
![]()
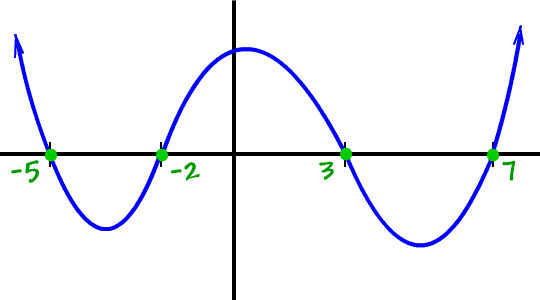
then draw a rough sketch of the graph.
Well, it sure looks creepy... but, it isn't! First of all, if we multiplied this mess out, the leading term would be

So, his basic shape is 
Let's find the zeros...
| Set | |
and solve... |

real zeros: -5, -2, 3, 7
Draw it!

*Remember, this is just a rough sketch!
Hey! Why don't you check this on the graphing calculator?
If you'd multiply him all out, he'd be

So, you'll enter him as
x^4-3x^3-39x^2+47x+210
But, there's one more thing we need to do...
It turns out that this guy is REALLY tall!
| Go ahead and hit the | button to graph him and you'll see | |
| what I mean. |
To get the full picture, let's change the settings at the bottom of the calculator... See them? Set them to:

Cool, huh?