![]()
But, what if we stick an inequality in there?
![]()
Don't worry. If you use your head, it's not that bad. It's just one more thing to worry about.
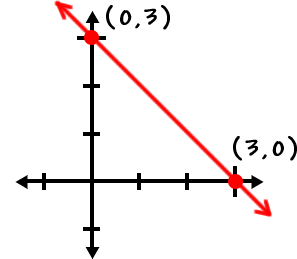
Let's graph the line:
 |
|
||||||||
Remember that this rectangular coordinate grid is just made up of a bunch of ( x , y ) points.
All the points ON the line work in this part:
![]()
Now, we just need to find all the points that work in this part:
![]()
Here's how we find these points:
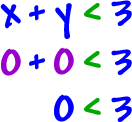
We just pick a point OFF the line and test it!
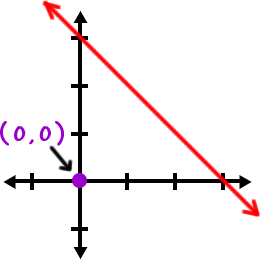 |
The origin,
( 0 , 0 ), is really
easy to work with, so let's
try it:
|
Here's the deal:
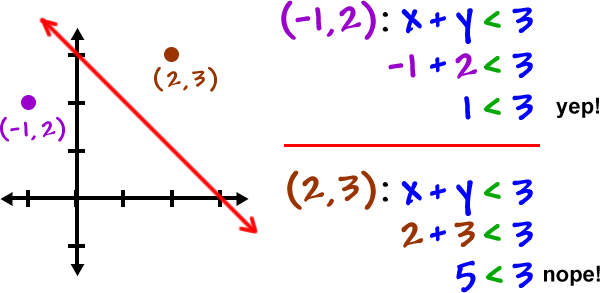
If
( 0 , 0 )
works, then ALL the points
on the same side of the line will
work.
Don't believe me? Let's try a couple more:
 |
So, our answer is this:
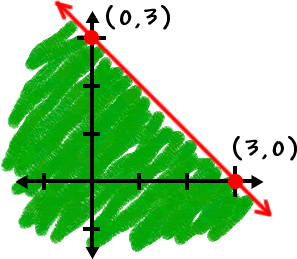 |
All the
( x , y )
points on the line and in the
shaded region work in
|
