Let's
plot
![]() ...
...
![]() ...
...
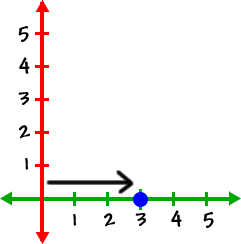
So, we'll go over to positive 3 on the axis...
and
![]() ...
...
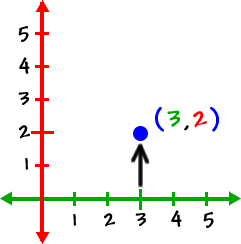
So, we'll go up 2 (the positive direction) in the y direction...
What
about
![]() ?
?
![]() ... So, we don't go anywhere in the
x direction...
... So, we don't go anywhere in the
x direction...
![]() ...
...
So, we go down 5 (because it's negative) in the y direction...